Below you find my personal collection links, scripts, guides and graphics you might find
neat, or useful.
- Link'O'Rama
- Personal credo
- Gnuplot extrapolations with errorbars
- arXiv logo
- How to fix your citation index
- RSS-feed of PRL's newly accepted and cond-mat with authors
- MathJax
- Guide to migrate from Linux to MacOSX
- Condensed matter job sites
- Word count of TeX manuscript for Phys. Rev. Lett.
- Shell script to create histograms
- Shell script to manage ssh keys
- Honeycomb lattice graphics
- YouTube science
- Shell script grepskip
- Setup your Raspberry Pi as an AirPrint server
- Calling C/C++ routines from Fortran
Link'O'Rama
- PaperScape is an awesome visualization of citations between papers on the arXiv.
- The Hubble Ultra Deep Field, one of the most profound and humbling images in all of human history.
- Support the gorgeous In Saturn's Rings project. A movie made from NASA stills - no CGI and surreal-real.
- Follow a camera traveling away from the sun at the speed of light in realtime in Riding Light.
- Looking for a new lens? Find decent reviews at the Digital Preview and The Digital Picture.
- ScienceBasedMedicine.org, a educational blog by professionals refuting common misconceptions in medicine and SCAM.
- JavaScript remake of the epic Commodore 64 game Impossible Mission. My favorite game of the C64 era, and yes, I'm that old.
- PhD Comics. Everyones favorite way to procastinate.
- Wolfram's Mathworld, together with Wolfram's Gallery, always worth a look.
- Find A Grave - find where your favorite celebrity's remains are buried; Including pictures, e.g., Boltzmann.s favorite gravestone.
- This is Collossal, a magnificent out-of-the-box art blog.
- A 1966 Documentary on the making of Kubrick's 2001: A Space Odyssey - my favorite ScFi movie.
- A blog of an artist who creates paintings of encounters with machinery in the everyday future world.
- These are the amazing shots of the sun you could take in your backyard!
- A collection of high-res trippy GIFs.
- A blog of scientific figures and pictures with aesthetic appeal.
- Remember the good old sounds of 14400Bd? Here is an example and what it means, explained by Oona Räisänen.
- Listen to Wikipedia being updated in real time, each update corresponding to a musical note.
Personal credo
You may, or may not sympathize with my love for strongly correlated physics, but I bet you will agree with something less controversial – my personal credo and the spot-on prose from an unidentified editor of New Scientist Magazine, asked about the philosophy of the magazine:
† Much less controversial than this.
Gnuplot extrapolations with errorbars
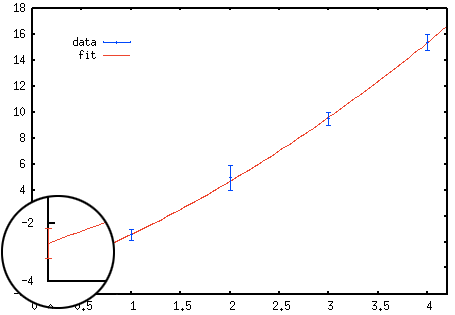 Adding errorbars on your extrapolations using Gnuplot requires a bit of tinkering.
To create a plot with errorbars like the one on the right a temporary file tmp
is used to store the extrapolated value and its error estimate. In order to access
the error estimates from the fit one needs to invoke set fit errorvariables
before fitting. The fitted function is then plotted together with a single point with
errorbars at x = 0.
Adding errorbars on your extrapolations using Gnuplot requires a bit of tinkering.
To create a plot with errorbars like the one on the right a temporary file tmp
is used to store the extrapolated value and its error estimate. In order to access
the error estimates from the fit one needs to invoke set fit errorvariables
before fitting. The fitted function is then plotted together with a single point with
errorbars at x = 0.
Here is an example, where I extrapolate the data points with errors stored in data
to
x → 0 using the fit function f(x) = a + b x + c x2. The
mean value and its errorbars for the extrapolation at x = 0 are the simply given
by the values of a and a_err, respectively.
                  data = "/tmp/gnuplot.data"
                  set print data
                  print "1 0.549846 0.450154\n2 4.9544 0.954397\n3 9.49577 0.49577\n4 15.3761 0.623939\n"

                  tmp = "/tmp/gnuplot.xtrapolated"
                  set print tmp

                  set fit errorvariables
                  f(x) = a + b*x + c*x**2
                  fit f(x) data u 1:2:3 yerr via a,b,c
                  set print tmp
                  print "\n\n0.0 ",a,a_err

                  p data u 1:2:3 w yerr lt 3 pt 1, f(x) lt 1 t '', tmp u 1:2:3 w yerr lt 1 pt 0 t ''

arXiv Logo
No, I will not give up the original arXiv logo! Ever needed a vector graphics version of the awesome arXiv logo? No? Anyways,
here is a the EPS and the PDF version of what I've cooked up. Feel free to use
and modify it! 

Linux → MacOSX
Linux rocks! Nevertheless I spent too much time tinkering with the operating system, which made me rethink my priorities: configurability vs. operability. As a numerical physicist I spent most of my time in the shell, coding, writing TeX and preparing figures for papers, lectures or notes. Mac provides me the perfect blend of software and OS. I have compiled a list of steps for the initial setup of on this page

RSS-feed
PRL's newly accepted
With the help from Howto Create an RSS 2.0 Feed I've created a feed which post-processes the "Condensed Matter: Electronic Properties" section of PRL's newly accepted (not yet published) papers list. You can checkout and subscribe to the feed here.

Job sites
The are several job-sites our there. Maybe the most popular are by the APS and Physics today. For faculty job postings, shortlist rumors and faculty shuffle check out the CM & AMO Physics Rumor Mill, @cmamorumor (unfortunatley, this seems to be dead). If you know more, please leave a comment!
RSS-feed
cond-mat with authors
Although the arXiv provides a multitude of RSS-feeds, I don't like their format. In particular I'm missing the list of authors. So I've tinkered another RSS-feed using the arXiv API export function to fetch the latest publications and post-processes them into a valid RSS-feed which also includes the authors, here.

MathJax
Check out MathJax to use TeX formulas on your webpages, e.g., $$ \int d\varepsilon \frac{1}{{\rm e}^{(\varepsilon-\mu) / {\rm k} T}\,+ 1} $$ is JavaScript interpreted, easily editable TeX code without the need to use images.
TeX word count for Physical Review Letters
This little script uses the CTAN Perl-script texcount to count the number of word in a TeX file (omitting TeX-statements) and extractbb to extract the aspect ratio of all used figures in order to compute the number of words equivalent used by figures according to the standards of the Physical Review Letters. Usage: PRLtexcount ⟨tex-files⟩
                  #!/bin/bash

                  texcount=$(which texcount)

                  sum=0
                  for file in $@; do

                     words=$($texcount -1 -sum $file)
                     printf "%8d %s\n" $words $file
                     sum=$((sum+words))

                     for figure in $( \
                        grep -e '\includegraphics' $file | \
                        grep -v '%.*\includegraphics' | \
                        grep -o '{.*}' | \
                        sed 's/[\{,\}]//g' ); do
                        if [ -e $figure ]; then
                           figure=${figure:0:${#figure}-4}
                        fi

                        if [ -e $figure.eps ]; then
                           figure=$figure.eps
                        elif [ -e $figure.pdf ]; then
                           figure=$figure.pdf
                        elif [ -e $figure.png ]; then
                           figure=$figure.png
                        fi

                        words=$(extractbb -O $figure | grep '%%BoundingBox' | \
                           awk '{print int(150/(($4-$1)/($5-$2))+20)}')
                        printf "%8d %s\n" $words $figure
                        sum=$((sum+words))
                     done

                  done

                  echo "-------------------"
                  printf "%8d total\n" $sum
Following the guidelines for calculating length the word equivalent for figures can be simplified estimated from the figures's aspect ratio (width / height) using the formula [(150 / aspect ratio) + 20 words] for single-column figures, and {[300 / (0.5 * aspect ratio)] + 40 words} for double column figures. In the script above I have considered single-column figures only.
You can download the script here: PRLtexcount (make sure to put it in a directory in your $PATH and make it executable).
Histograms in the shell & gnuplot
This is a nice shell script (author unknown) which uses awk to produce a histogram from a data set. This can be especially useful in combination with gnuplot, e.g., for the original data set data.dat use the line
gnuplot> p "< histogram data.dat 100" u 1:2 w boxes
in gnuplot to plot the histogram of data.dat with 100 subdivisions (bins) of the whole data range. Unfortunately, the script's origin is lost - I apologize for not being able to crediting the original author. You can download the script here: histogram (make sure to put it in a directory in your $PATH and make it executable).
                  #!/bin/bash

                  FILE=$1 # input file
                  BINS=$2 # number of bins

                  if [ "$#" != "2" ] || [ ! -f $FILE ]; then
                     echo 'usage: histogram <file> <#bins>'
                     exit 1
                  fi

                  # determine border values
                  MIN=$(awk 'NR == 1 || $1 < min {line = $0; min = $1} END {print line}' $FILE)
                  MAX=$(awk 'NR == 1 || $1 > max {line = $0; max = $1} END {print line}' $FILE)

                  # use awk to bin data
                  awk -v m=$MIN -v M=$MAX -v b=$BINS 'BEGIN {

                    w = (M-m)/b      # width of each bin

                    # set up arrays
                    for (i = 1 ; i <= b; ++i) {
                      n[i] = m+(i*w)        # upper bound of bin
                      c[i] = n[i] - (w/2)   # centre of bin
                      f[i] = 0              # frequency count
                    }
                  }

                  {
                    # bin the data
                    for (i = 1; i <= b; ++i)
                      if ($1 <= n[i]) {
                           ++f[i]
                           break
                      }
                  }

                  END {
                    # print results to a file for plotting

                    for (i = 1; i <= b; ++i) {
                      if (f[i] > 0) {
                        print c[i],"\t", f[i]
                      }
                      else {
                        print c[i], 0
                      }
                    }
                  }' $FILE
Note, that gnuplot of course can create histograms intrinsically using the commands
gnuplot> binwidth=5
gnuplot> bin(x,width)=width*floor(x/width)
gnuplot> p 'data.dat' u (bin($1,binwidth)):(1.0) smooth freq with boxes
SSH keys
SSH keys serve as a means of identifying yourself to an SSH server using public-key cryptography without the need of passwords. SSH key authentication offers additional security and convenience, but is not without drawbacks and may not be appropriate for all environments. One of the many introductions onto the SSH keys framework can be found in this article.
Below is a shell script which essentially voids the need to remember the last two lines. Its purpose is to distribute your public SSH key to a remote host, such that future use of your password becomes obsolete. You can download the script here: ssh-keyput (make sure to put it in a directory in your $PATH and make it executable).
                  #!/bin/bash

                  RHOST=$1
                  if [ "$RHOST" = "" ]; then
                     echo -e "usage: ssh-keyput <host>\n"
                     exit 1
                  fi

                  if [ ! -e "${HOME}/.ssh/id_dsa.pub" ]; then
                     echo "No public key has been found in ${HOME}/.ssh/"
                     ssh-keygen -t dsa
                  fi

                  cat ${HOME}/.ssh/id_dsa.pub | ssh $RHOST 'sh -c "cat - >>~/.ssh/authorized_keys"'
                  ssh-agent sh -c 'ssh-add < /dev/null && bash'
The script tests if you have an existing dsa-key (stored by default in $HOME/.ssh/id_dsa.pub) and transfers the public part to the new host, in order to avoid the the password query. Invoke
$ ssh-keyput user@remotehost
and you'll be asked for the last time to enter your password on the remote host. Then make sure you enter a new shell and test your password-free connection using ssh keyes.
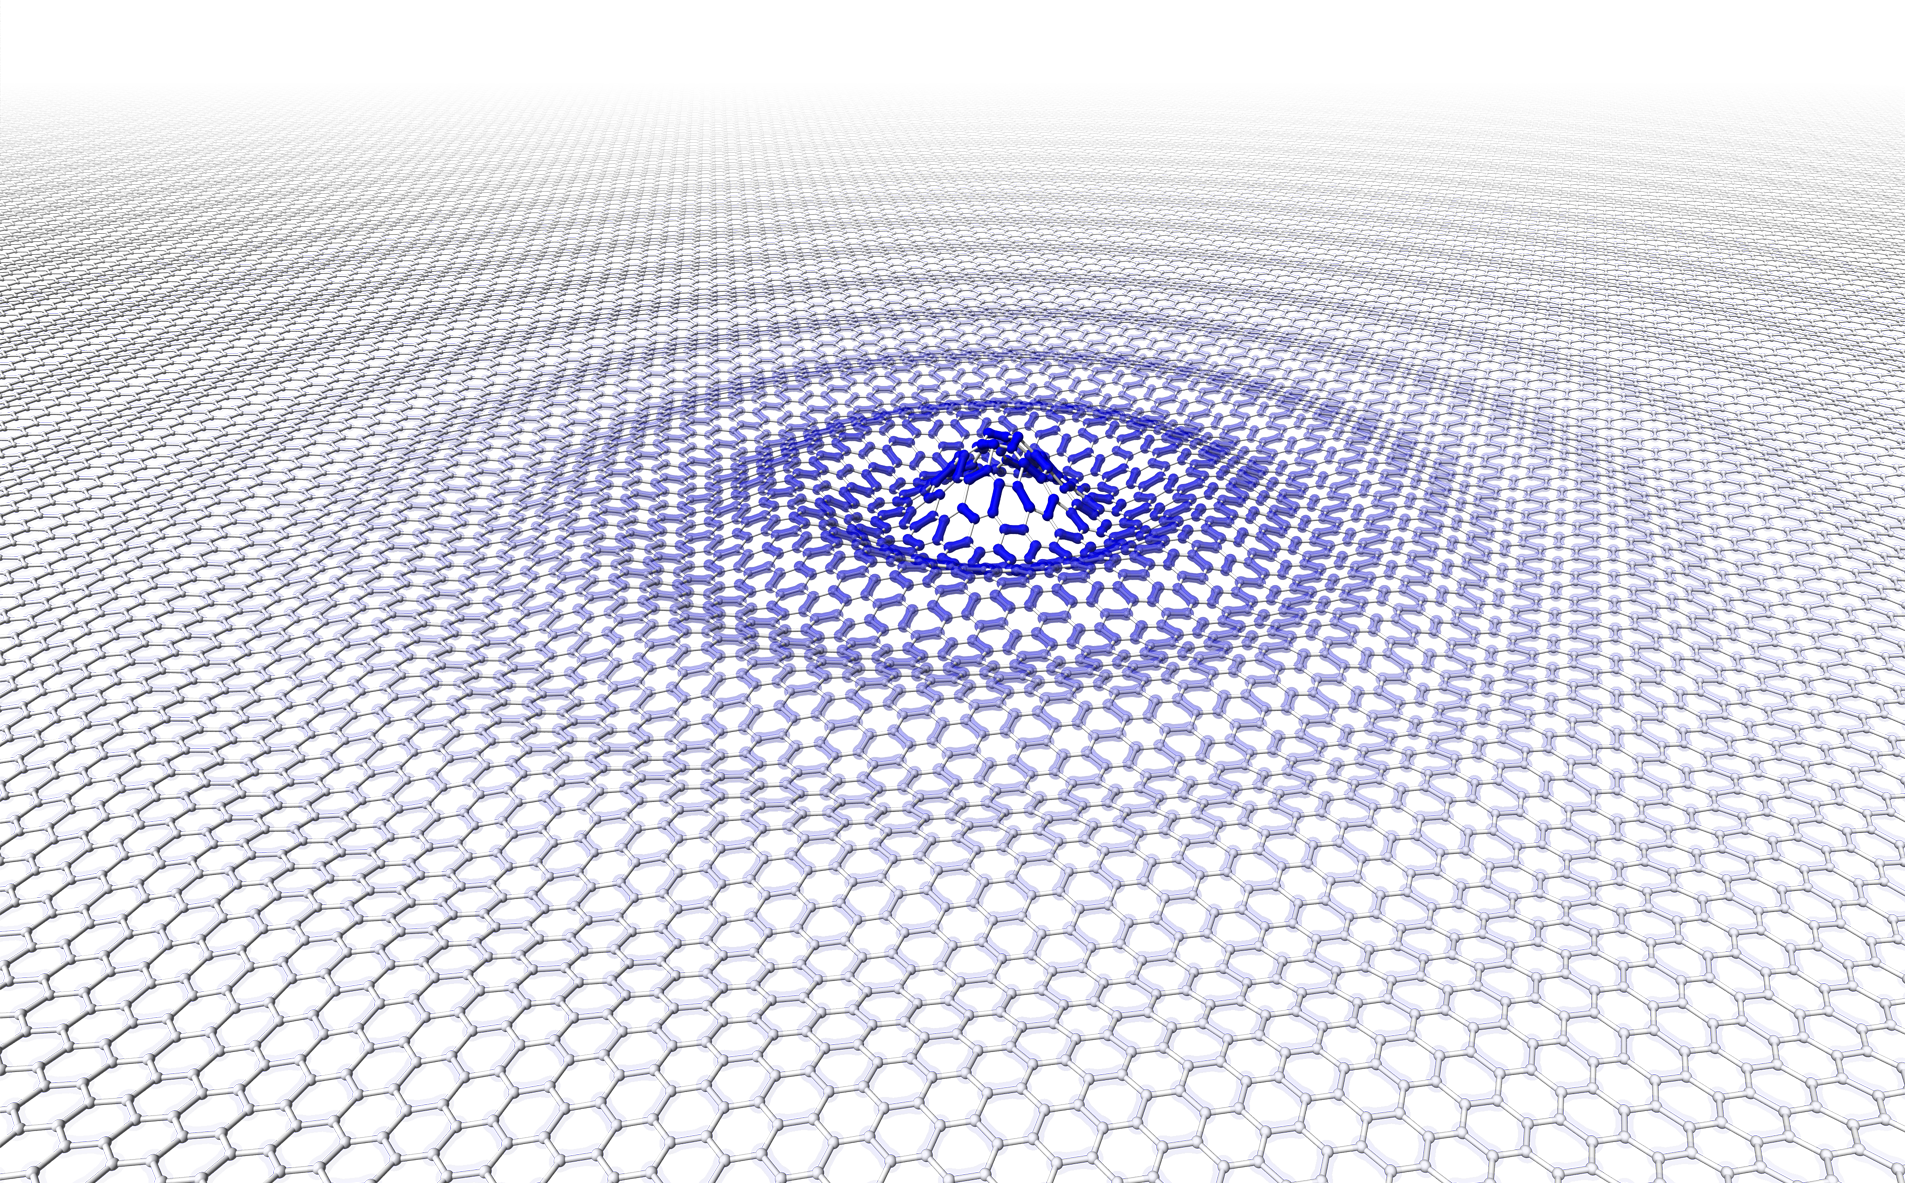
Honeycomb & twisted graphene lattice graphics
Since I have been repeatedly asked for graphics I used in talks and papers
I here provide high resolution versions of a few popular images for use under
.
Click on the preview images to obtain the high-res version.


YouTube Science
There is a huge number of small and large experiments, educational channels and the fair amount of woo on YouTube. Here are a few of my favorite physics related posts/channels:
An intruiging phenomenon from the Steve Mould's YouTube channel, that should remind you that classical mechanics can still be fascinating. UPDATE
This is an example by Tim Hutton of Stephan Rafler's SmoothLife - a generalization of Conway's "Game of Life" to the continuous domain. Details are presented in this paper. Here are more examples.

The The Royal Institution YouTube channel is a source of high quality science clips as well as longer presentations including the famous RI Christmas Lectures.

The YouTube channel MinutePhysics tackles questions, such as Why is it Dark at Night? in 60 seconds bites (sometimes in only 9.9999s) - and that well researched and presented.

Veritasium is a YouTube on popular scientific topics and everyday questions. Their explainations are fairly well researched, but more on the entertainment side.

Vsauce is collaborating infrequently with Veritasium and MinutePhysics is actually a collection of channels, which covers a broad selection of topics from to science and technology to fictional worlds.

Kurzgesagt (german for 'In a Nutshell') is a beautifully illustrated, fairly well researched channel covering soft and hard science topics, as well as the humanities.

3Blue1Brown aims to explain math and difficult problems by high quality animations and new perspectives.

Enter the world of the Mathologer for really accessible explanations of hard and beautiful math(s).

Videos about numbers - it's that simple.

Very well produced, explained and knowledgeable, Space Time explores the outer reaches of space, the craziness of astrophysics, the possibilities of SciFi.
Shellscript grepskip
Ever so often I need to grep a certain line from a file. The problem is, I do not need the line of the regular expression I can provide, but the n-th line after. For this purpose I wrote the little script grepskip.
#!/usr/bin/perl

if (@ARGV < 3)
{  die "usage: grepskip <expr> [expr] ... <nskip> <file>\n\n";
}

@expressions = ();
for ($i=0;$i<@ARGV-2;$i++)
{  push(@expressions,@ARGV[$i]);
}

$file = $ARGV[@ARGV-1];
$nskip = $ARGV[@ARGV-2];

open(FID,"<$file") || die "unable to open $file";
@line = <FID>;
close(FID);

for ($i=0;$i<@line;$i++)
{  foreach $exp (@expressions)
   {  if ($line[$i] =~ m/.*$exp.*/)
      {  print $line[$i+$nskip];
      }
   }
}
Here is an example, how it works. Let the file data.dat contain the lines:
                  0.0   0.0
                     0.283084   0.040688
                     0.364561   0.155806
                  1.0   0.0
                     0.998068   0.215512
                     0.812932   0.552596
                  0.0   1.0
                     0.884292   0.177753
                     0.764657   0.142434
To extract the second line after the pattern ' 0.0$', without knowing which lines match the pattern we can use
$ grepskip '   0.0$' 2 data.dat
   0.364561   0.155806
   0.812932   0.552596
Setup your Raspberry Pi as an AirPrint server
Here are the step-by-step instructions on how to setup your ![]() Raspberry Pi running
Raspbian (or any other debian system) as an AirPrint server. I am essentially
reproducing the HOWTOs found here
and here.
First of all, let's install cups (if not already installed):
Raspberry Pi running
Raspbian (or any other debian system) as an AirPrint server. I am essentially
reproducing the HOWTOs found here
and here.
First of all, let's install cups (if not already installed):
$ sudo apt-get install cups
Add your user (default user name is pi) to the group lpadmin to allow it administrate CUPS.
$ sudo usermod -a -G lpadmin pi
We also need to tell CUPS to alias itself to any hostname as AirPrint communicates with CUPS with a different hostname than the machine-defined one. To do this, we edit the CUPS configuration file and add the directive ServerAlias * before the <Location /> block. (You might want to use vi and do it manually, instead).
$ sudo sed -i -e 's/<Location \/>/ServerAlias *\n<Location \/>/' /etc/cups/cupsd.conf
Connect (as user pi, not root!) to the CUPS web-interface using midori (or better iceweasel)
$ midori https://localhost:631
and setup the new printer. You'll need to authenticate with your systems username and password. Make sure you check 'Share This Printer' during the printer setup! Note, there is no need to set 'Share printers' in the Server Settings: section on CUPS's Administration page. With the aid of Timothy J. Fontaine's python script we can now generate avahi announcements that will make iOS think that our printer is AirPrint capable. For that you’ll need the Python CUPS module and the avahi daemon (again we'll do this in a root-shell):
$ sudo apt-get install python-cups avahi-daemon
$ sudo /etc/init.d/avahi-daemon start
Now, we’ll download Tim’s Python script to generate the avahi announcements for all installed CUPS printers and restart the daemon
$ sudo mkdir /opt/airprint
$ sudo cd /opt/airprint
$ sudo wget -O airprint-generate.py --no-check-certificate \
     https://raw.github.com/tjfontaine/airprint-generate/master/airprint-generate.py
$ sudo chmod +x airprint-generate.py
$ sudo ./airprint-generate.py -d /etc/avahi/services
$ sudo /etc/init.d/avahi-daemon restart
And that's all there is to do. As long as your iOS device is in the same subnet you should now find the AirPrint representatives of your installed printers.
Calling C/C++ routines from Fortran
Here are two examples of frequently used system functions implemented in C and called from Fortran. While these might be available as intrinsic functions in you compiler of choice, their implementation would be specific to your compiler and not part of the Fortran standard and hence not portable, unless implemented in C. Note that the functions are listed twice, once with and once without the trailing underscore - this is to stay compatible with different Fortran compilers which implement different naming conventions.
The first example is a function to obtain the process ID (PID) of the program you are running (fgetpid.c).
#include <unistd.h>

void fgetpid_(int *id)
{
   *id = (int)getpid();
}

void fgetpid(int *id)
{
   *id = (int)getpid();
}
You can call the function from Fortran via:
INTEGER :: pid
CALL fgetpid(pid)
WRITE(*,*) pid
At the linking stage don't forget to also link to fgetpid.o! The second example is execution of system commands using C's system command (exec.c).
#include <stdlib.h>
#include <stdio.h>
#include <string.h>

void exec_(char *cmd, int *cmdLen, int *stat)
{
   char *cmdcpy;

   if(!(cmdcpy=(char*)malloc(*cmdLen+1)))
   {  fprintf(stderr,"exec: malloc failed\n");
      exit(1);
   }
   strncpy(cmdcpy,cmd,*cmdLen);
   cmdcpy[*cmdLen]='\0';
   *stat = system(cmdcpy);

   free(cmdcpy);
   return;
}


void exec(char *cmd, int *cmdLen, int *stat)
{
   char *cmdcpy;

   if(!(cmdcpy=(char*)malloc(*cmdLen+1)))
   {  fprintf(stderr,"exec: malloc failed\n");
      exit(1);
   }
   strncpy(cmdcpy,cmd,*cmdLen);
   cmdcpy[*cmdLen]='\0';
   *stat = system(cmdcpy);

   free(cmdcpy);
   return;
}
Execute system commands in Fortran via:
CHARACTER(len=128) :: cmd
INTEGER :: ierr
cmd = 'touch test.dat'
CALL exec(trim(cmd),len_trim(cmd),ierr)